PDi CRM has a desktop that will display widgets to access information from PDi CRM, Pastel, or both. Widgets can display data in graph format, data cube (pivot style), report or grid layout. This gives the user information in an easy to view representation.
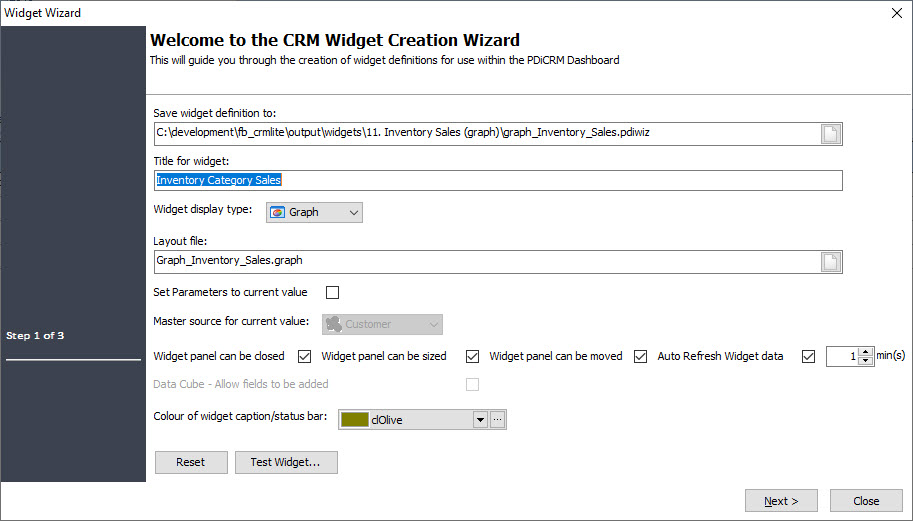
Save widget definition |
Enter or select the file to save the widget to. If the widget already exists, the information can be loaded to create a new widget (by changing the save to filename) or update the existing widget. |
|---|---|
Title for Widget |
Enter the title of the widget that will appear on the Widget desktop |
Widget display type |
Select the type of widget o display Graph, Report, Data Grid or Data Cube (Pivot table) |
Layout file |
Select the layout file to save, and it will be used as the default for the widget. This will either by the graph settings, data grid, report or data cube method. |
Set Parameter to current value |
If the widget is linked to the current master value, tick this box and select the master source. This will allow the report to run against the current customer, supplier, prospect or inventory code. |
Master source for current value |
Select the master source for the current value Customer, Supplier, Prospect or Inventory |
Widget Panel can be closed |
Tick if the user can close the widget |
Widget Panel can be sized |
Tick to allow the user to size the panel (this should be ticked) |
Widget Panel can be moved |
Allow the user to move the widget around with the Widget Desktop |
Auto-Refresh widget date |
Set to the number of minutes that the widget should be refreshed and the current data updated |
Data Cube - Allow fields to be added |
If the widget display type is a data cube (pivot), then tick this if the users can add additional fields to the designed data cube. |
Colour of widget caption |
Set the colour of the caption to display for this widget |
Reset |
Reset the settings back to default |
Test Widget |
Use to view the widget once it has been fully created |
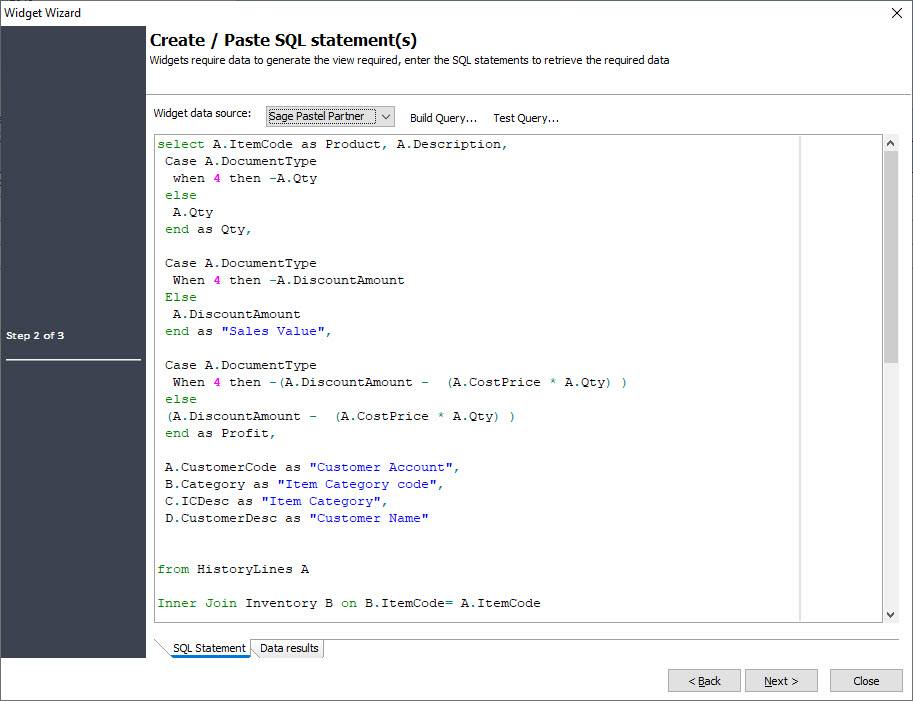
Create / Pastel SQL |
This step will create the SQL statement used to retrieve data from Sage50c Pastel, CRM or a combination. Enter (or Paste) the SQL statement into the text area. If this is a combination of data sources, then the Sage50c, CRM and combined SQL statements.
The Build Query button will display a simple drag, drop and tick to create a simple SQL Statement. |
|---|---|
Test Query |
This will execute the SQL Statement and view the results. You can then adjust the SQL statement if the information retrieved is not as expected. |
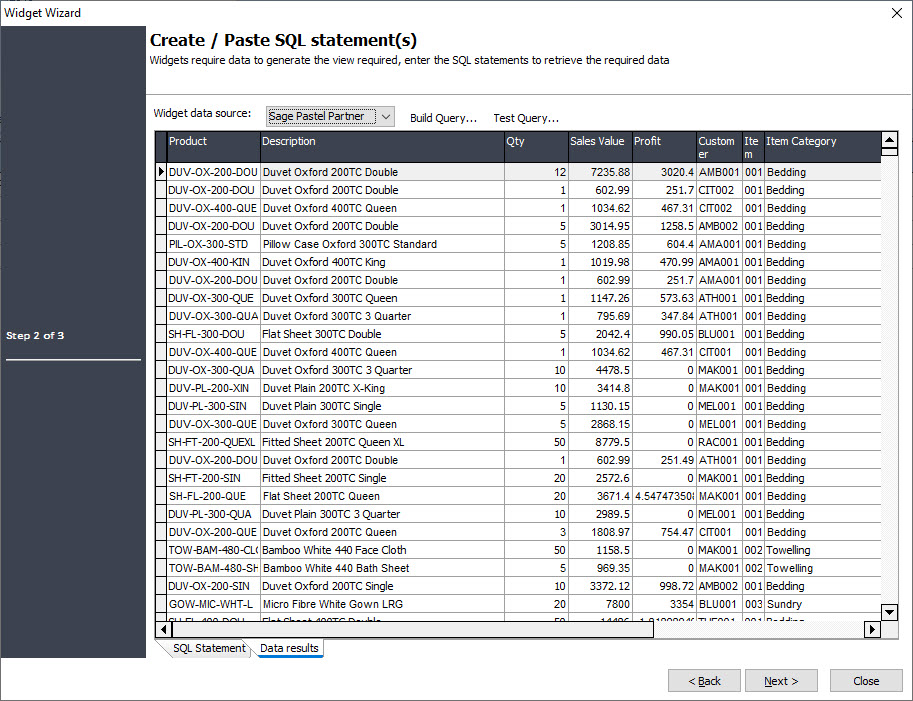
Data Results |
The results will be displayed if the SQL is not tested and the Next button is pressed
|
|---|
Graph
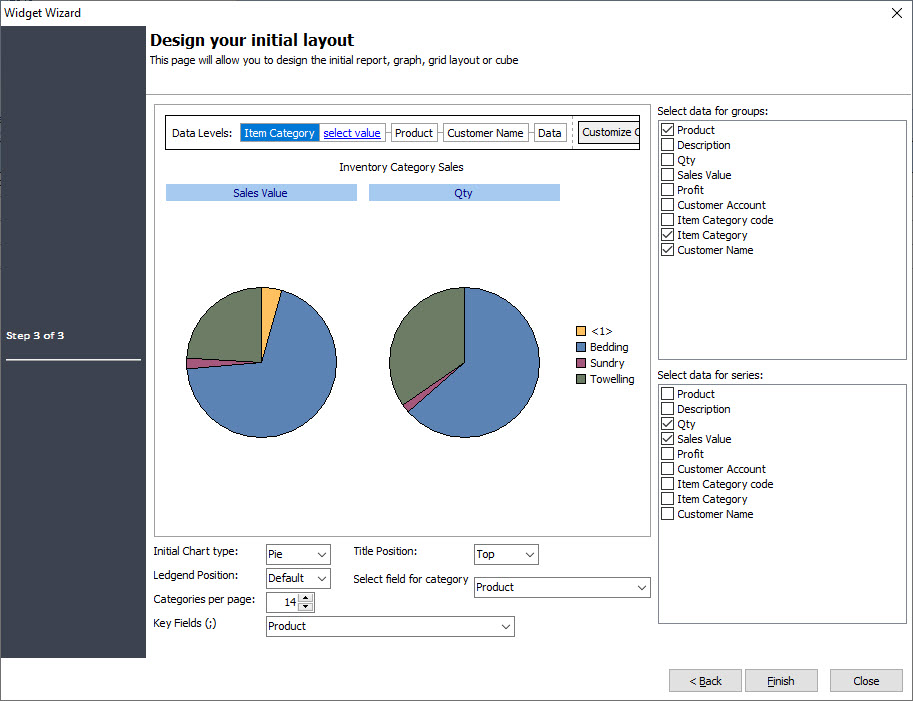
Data groups |
Select the type of information to display; this can be used to drill down |
|---|---|
Data Series |
Select the actual values that will be used within the graph |
Chart type |
Select the chart type to view Pie, Line, Bar, Area Graph |
Legend Position |
Select the position of the legend for the data displayed |
Categories per page |
If using a Pie, Line, bar enter the number of categories to display on each page |
Key Fields |
Indicate the unique values from the table, may be multiple separate with; |
Title Position |
Select the position of the graph title |
Select field for category |
Select the field to use for the main category |
Key Fields |
Enter or select the unique field that is used within the data results. This can be a multiple of fields separated with ;
|
|---|---|
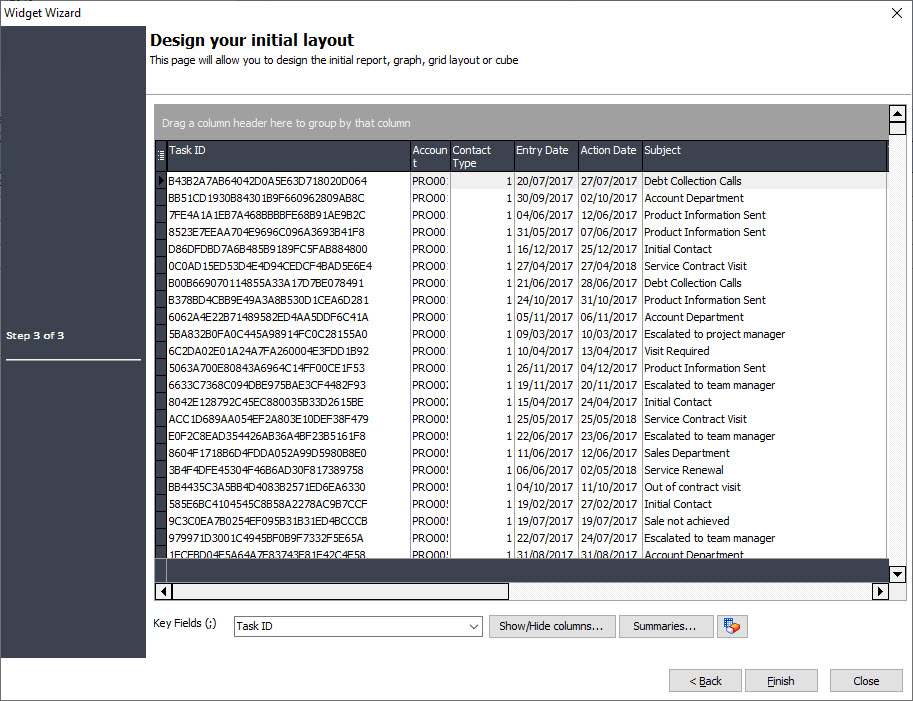
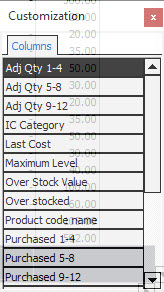
Show/Hide
|
Press to the indicate which fields should be included in the grid. The
Columns can be re-positioned by clicking on them, holding the button down, and dragging them into the required position.
Resize the column widths by clicking on the line between columns and then increasing or decreasing the size of the column. |
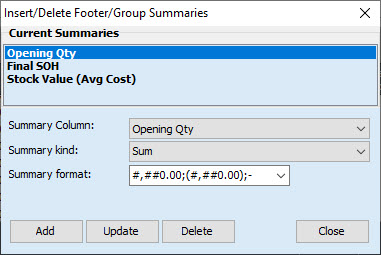
Summaries
|
The summaries grid displays the columns that already have summary values and allows new columns to be added.
Press the Add button to create a new entry and select the column to include a summary from the drop-down list.
Summary kind - Select the kind of summary to apply the column Sum, Count, Max, Min, Average.
Summary format: Enter or select the type of format to apply to the column summary
Once changes have been made, press the Update button to apply them to the column. Remove summaries by pressing the Delete button.
|
Data-Cube (Pivot)
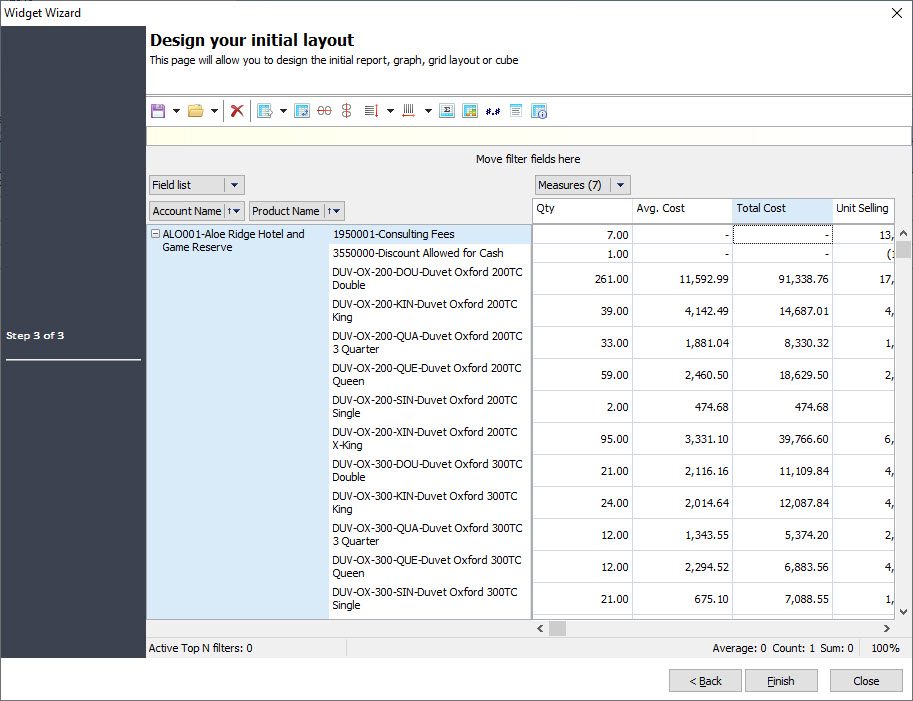
Fields |
Drag fields from the field list to the primary data area (In the example, where customers and products are displayed).
Measures and data slices can be managed using the context-sensitive menu or the toolbar to make changes.
See CRM Dolap for settings and functions
|
|---|
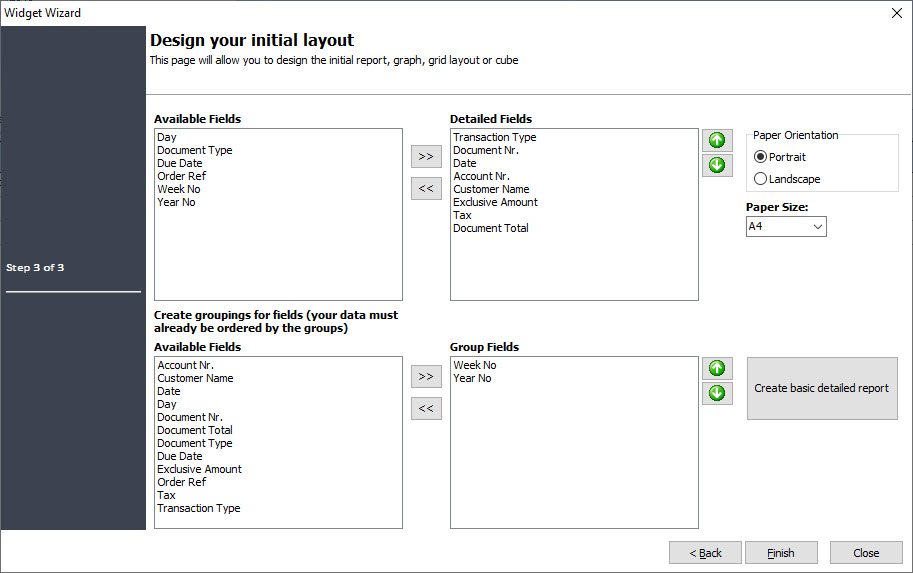
Report Layout
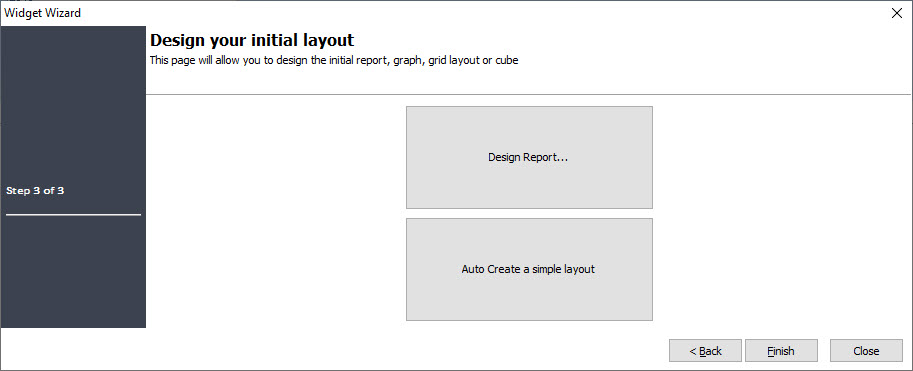
Design Report |
This will display the main report designer |
|---|---|
Auto Create |
This will create a basic report layout by selected the detailing fields and group fields, as shown below
|