The product sales process allows the user to retrieve a list of sales based on a given item category range, Item code range and date range.
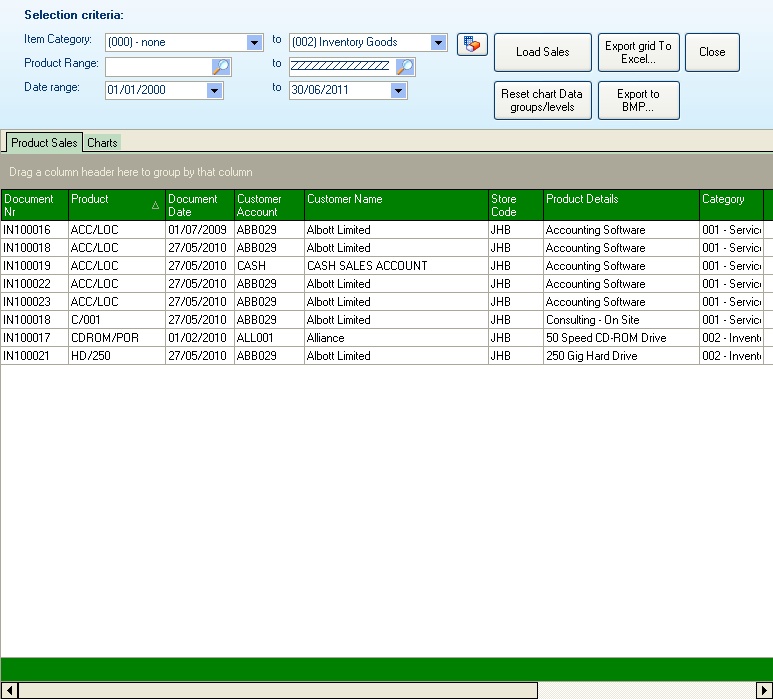
Once the selection criteria have been made, pressing the [Load Sales] button will populate the grid with the sales that match the criteria specified. Double-clicking on the grid allows either the document to be re-printed or the document details viewed to screen.
The grid can be exported to Excel for further comparison and manipulation.
The Charts tab allows the user to view the grid information in chart format (and export the chart to BMP format for inclusion within presentation documentation if required).
The chart can be formatted to show the required data, graph type, and value being graphed.
|
|
|
|
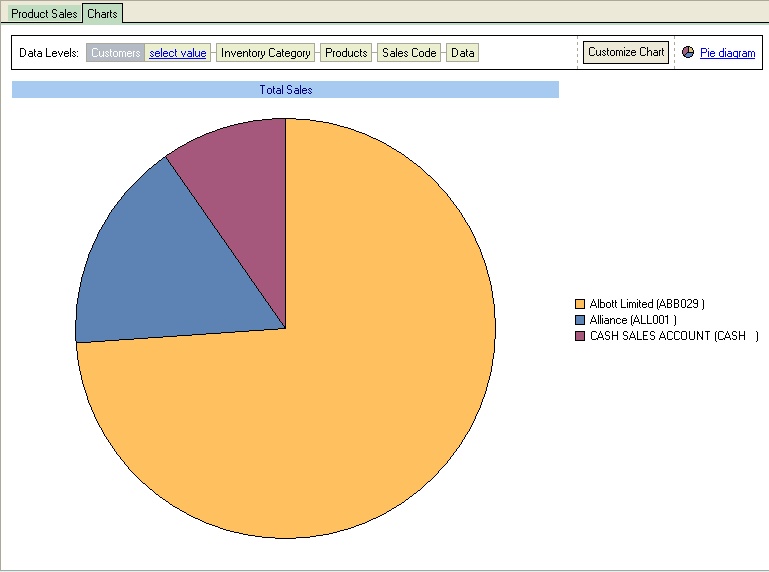
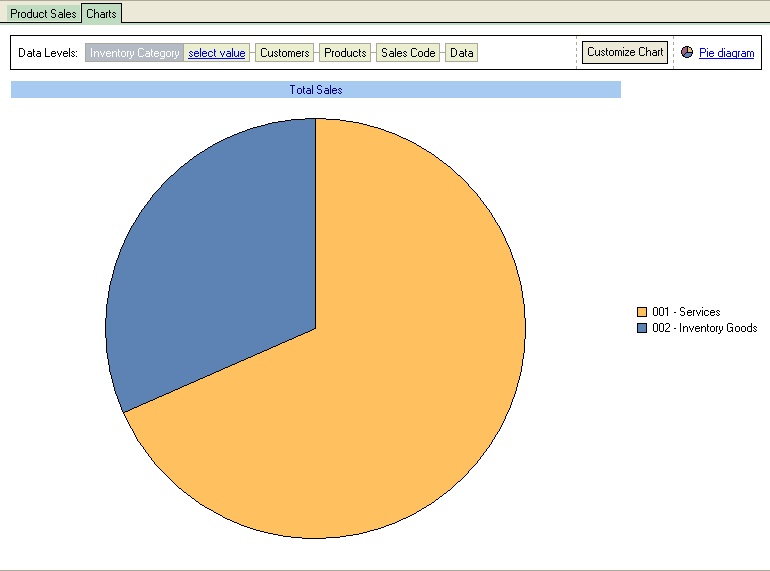
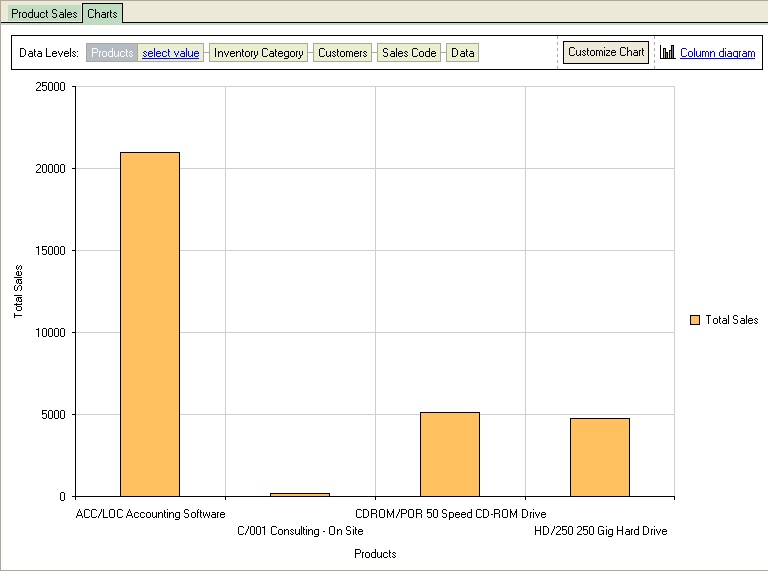
The information must be changed by dragging the required data level to the first position (the information can also be filtered by pressing the select value option).
|
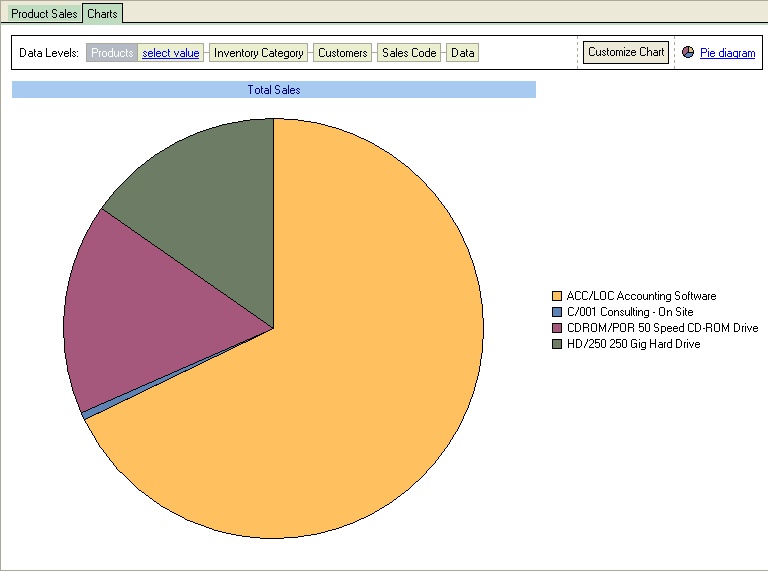
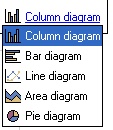
The type of graph can also be changed by pressing the graph type and selecting the required format from the drop-down list. The available graphs include Column Diagram (vertical bar), Bar diagram (horizontal bar), Line diagram, Area Diagram and the Pie diagram.
The graph can also be customised by pressing the Customize chart, which allows the user to select the type of value to graph (for this graph, it can be Total Sales or unit Price) and the options for the graph, including the position of the legends, alignment, orientation, title positions etc.
|
Drill down on the graphs is also available, enabling the user to drill down to a graph of the products making up the item category sales and the customers who purchased the products, down to the sales codes. The order of the drill depends on the Data level order selected by the user. To return to the original graph (top-level), press the Reset chart data groups/levels to reset the information to the topmost level.