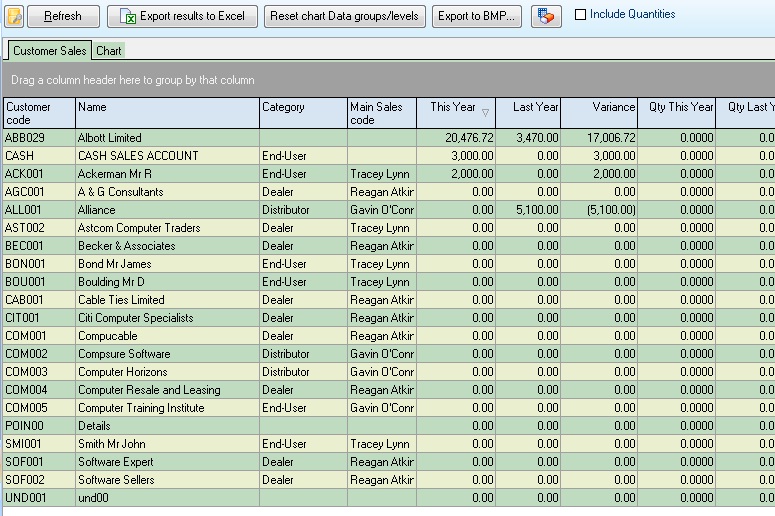
This process gives a grid of customer sales showing this year, last year and variances, and if they Include quantities is checked, then the total units sold (this method takes longer as it needs to iterate through the document lines from Pastel).
The grid can be exported using the Export results to Excel. It can also be filtered and grouped (by dragging the relevant column to the section that says 'Drag a column header here to group by that column.'
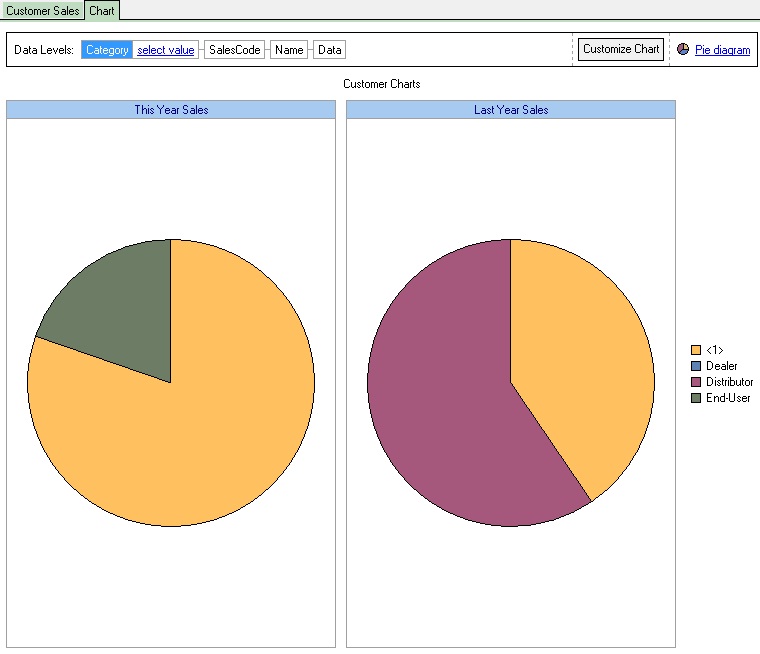
The chart tab displays a chart of this year’s Sales and Last sales figure using the selected chart type, i.e., Pie diagram, line graph, area graph etc. The Data levels can be re-ordered by dragging into the required position and filtered on the first data level using the Select value drop-down list. If everything gets too much, the charts and data levels can be reset using the Reset chart Data groups/levels. Graphs can also be exported to a BITMAP image file for inclusion in your presentation.