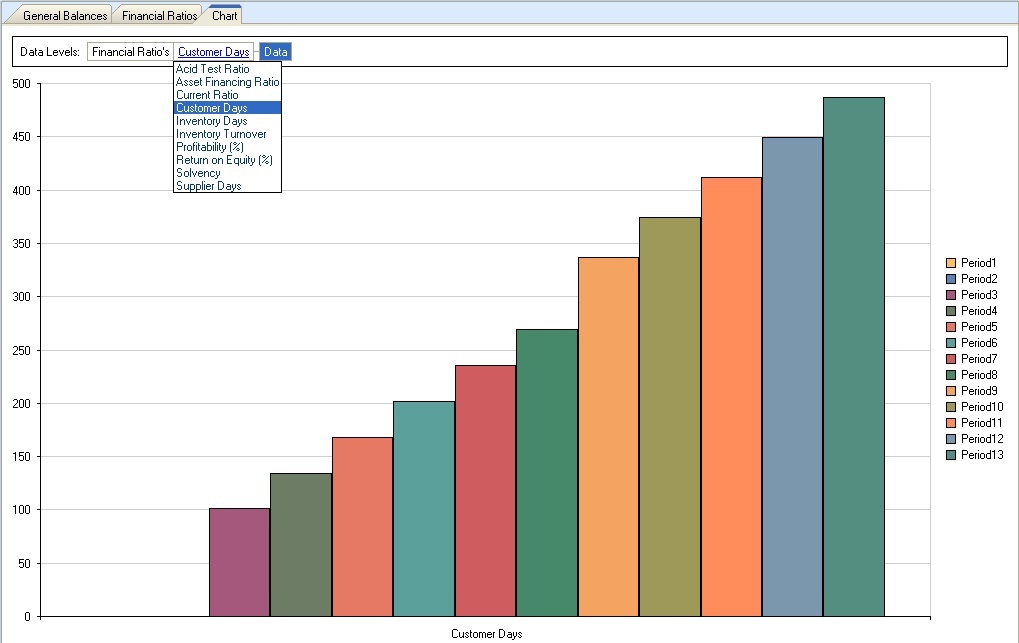
The fiscal charts can be selected by a click on the Data Levels > Financial Ratios; the graphs that can be selected are:
Acid Test Ratio
Asset Financing Ratio
Current Ratio
Customer Days
Inventory Days
Inventory Turn Over
Profitability (%)
Return on Equity ($)
Solvency
Supplier days